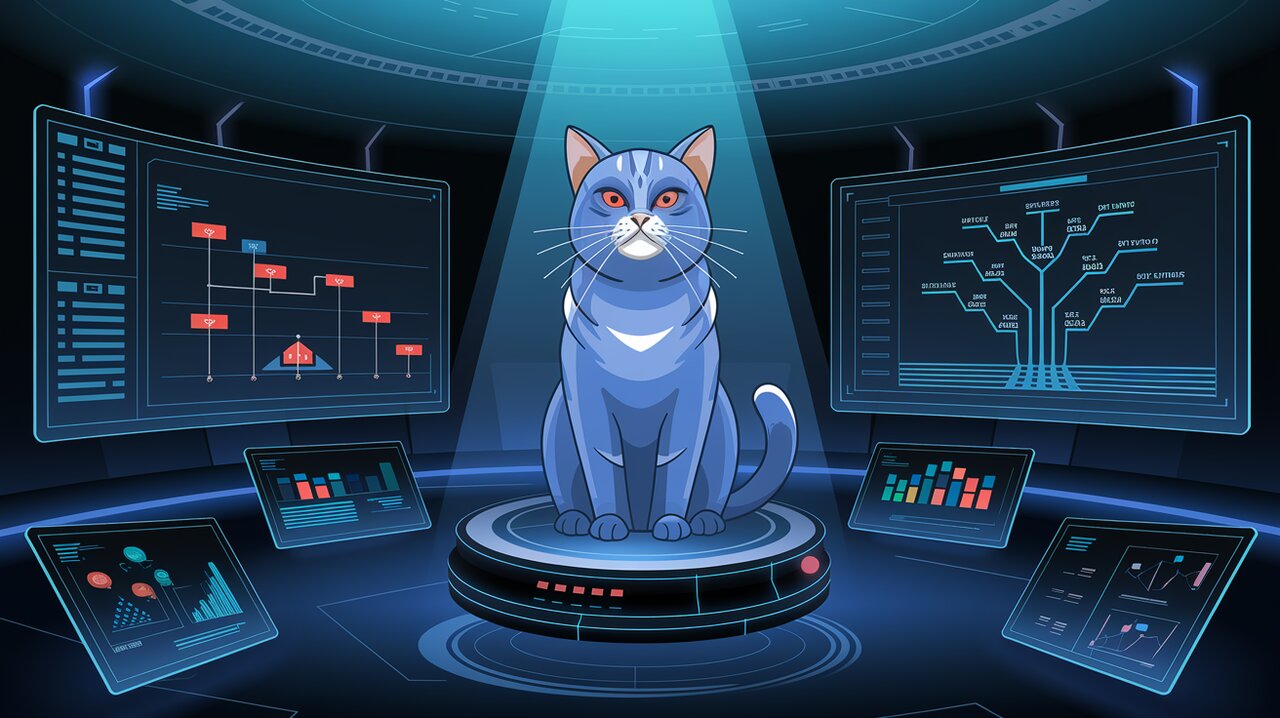
Chart Your Course: Navigating Redux State with Redux DevTools Chart Monitor
Redux DevTools Chart Monitor is a game-changing addition to the Redux ecosystem, offering developers a powerful way to visualize and debug their application’s state. As part of the Redux DevTools suite, this chart monitor transforms the often complex and abstract nature of state management into an intuitive, visual experience. Let’s dive into how this tool can revolutionize your debugging process and enhance your understanding of state flow in React applications.
Charting New Territory in State Debugging
Redux has long been a cornerstone of state management in React applications, but as projects grow in complexity, so does the challenge of tracking state changes. The Redux DevTools Chart Monitor addresses this by providing a visual representation of your state tree, making it easier than ever to navigate and understand the structure of your application’s state.
Key Features of Redux DevTools Chart Monitor
-
Tree Visualization: The chart monitor presents your Redux state as an interactive tree structure, allowing you to easily explore nested state objects.
-
Time Travel Debugging: Navigate through different states of your application by moving back and forth in time, a feature that’s invaluable for understanding how your state evolves.
-
State Diffs: Quickly identify changes between states with highlighted differences, making it simple to track mutations.
-
Customizable Display: Tailor the chart view to your needs with options to expand, collapse, and filter state nodes.
Setting Sail with Redux DevTools Chart Monitor
To begin using this powerful tool, you’ll need to integrate it into your Redux setup. Here’s how you can get started:
import { createStore, compose } from 'redux';
import { DevTools, persistState } from 'redux-devtools';
import { ChartMonitor } from 'redux-devtools-chart-monitor';

const enhancer = compose(
  DevTools.instrument(),
  persistState(window.location.href.match(/[?&]debug_session=([^&]+)\b/))
);

const store = createStore(rootReducer, enhancer);

// In your React component
<DevTools store={store} monitor={ChartMonitor} />
This setup integrates the Chart Monitor into your Redux DevTools, allowing you to visualize your state changes in real-time.
Navigating the State Seas
Once integrated, the Chart Monitor becomes your compass for navigating the sometimes turbulent waters of state management. Here’s how you can make the most of its features:
Exploring the State Tree
The chart presents your state as a hierarchical tree. Each node represents a part of your state, with branches expanding to reveal nested objects and arrays. This visual representation makes it easy to understand the structure of complex states at a glance.
Time Travel Debugging
One of the most powerful features of Redux DevTools is the ability to move through your application’s state history. The Chart Monitor enhances this experience by providing a visual timeline of state changes. You can:
- Click on different points in time to see how your state looked at that moment.
- Observe how actions affect the state tree by watching nodes change as you move through time.
Identifying State Changes
The Chart Monitor highlights changes between states, making it simple to identify which parts of your state are being modified by different actions. This feature is particularly useful when debugging unexpected state mutations or tracking the effects of complex action chains.
Advanced Charting Techniques
To truly master the Chart Monitor, consider these advanced techniques:
Custom Styling
Tailor the appearance of your chart to match your preferences or application theme:
<ChartMonitor
  theme="nicinabox"
  invertTheme={true}
  dataTypeKey="type"
  expandLevel={2}
/>
Filtering State
For large state trees, you can filter the display to focus on specific parts of your state:
<ChartMonitor
  shouldExpandNode={(keyName, data, level) => level < 3 || keyName === 'important'}
/>
This configuration will automatically expand nodes up to the third level and any node named ‘important’, helping you focus on the most relevant parts of your state.
Charting a Course for Better Debugging
The Redux DevTools Chart Monitor is more than just a debugging tool; it’s a window into the heart of your application’s state. By providing a visual representation of your Redux store, it enables developers to:
- Quickly identify and diagnose state-related issues
- Understand the structure and flow of data in complex applications
- Communicate state changes and application behavior to team members more effectively
As you become more familiar with the Chart Monitor, you’ll find that it not only speeds up your debugging process but also enhances your overall understanding of state management in React applications.
Conclusion: A New Horizon in State Management
Redux DevTools Chart Monitor opens up new possibilities for developers working with Redux. By transforming abstract state concepts into visual, interactive charts, it makes the process of managing and debugging state more intuitive and efficient. Whether you’re a seasoned Redux veteran or just starting your journey with state management, the Chart Monitor is an invaluable tool that will help you navigate the complexities of modern web application development with confidence.
As you continue to explore the capabilities of Redux DevTools Chart Monitor, you might also find it helpful to dive into related topics. For instance, our article on Redux DevTools Time Travel Symphony provides insights into the time-travel debugging feature, which complements the Chart Monitor beautifully. Additionally, for those looking to enhance their overall Redux debugging workflow, the Redux Debug Detective article offers valuable techniques that pair well with the visual insights provided by the Chart Monitor.
By incorporating Redux DevTools Chart Monitor into your development toolkit, you’re not just improving your debugging process – you’re gaining a deeper understanding of your application’s state architecture. This understanding will inevitably lead to better-designed, more maintainable React applications. So set sail with the Chart Monitor, and chart a course for smoother, more insightful Redux development!
